
Why Linear Regression is not suitable for Classification
Linear Regression vs Logistic Regression for Classification Tasks
This article explains why logistic regression performs better than linear regression for classification problems, and 2 reasons why linear regression is not suitable:
- the predicted value is continuous, not probabilistic
- sensitive to imbalance data when using linear regression for classification
Supervised learning is an essential part of machine learning. That is a task of learning from the examples in a training dataset, by mapping input variables to the outcome labels, which then can be used for predicting the outcome of a new observation. Examples of supervised learning classification tasks are:
- Given a list of passengers who survived and did not survive the sinking of the Titanic, predict if someone might survive the disaster (from Kaggle)
- Given a set of images of cats and dogs, identify if the next image contains a dog or a cat (from Kaggle)
- Given a set of movie reviews with sentiment label, identify a new review’s sentiment (from Kaggle)
- Given images of hand-drawn digit from 0 to 9, identify a number on a hand-drawn digit image (from Kaggle)
Examples 1 and 2 are examples of binary classification problems, where there are only two possible outcomes (or classes). Examples 3 and 4 are examples of multiclass classification problems where there are more than two outcomes.
Can classification problems be solved using Linear Regression?
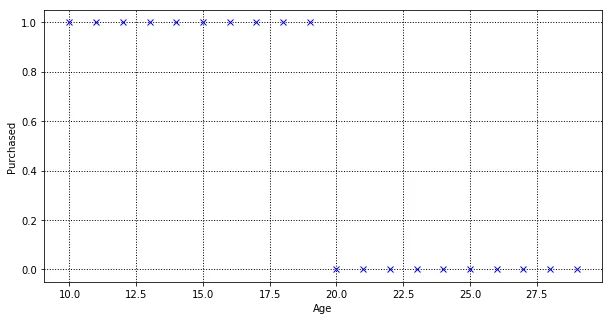
Let’s say we create a perfectly balanced dataset (as all things should be), where it contains a list of customers and a label to determine if the customer had purchased. In the dataset, there are 20 customers. 10 customers age between 10 to 19 who purchased, and 10 customers age between 20 to 29 who did not purchase. “Purchased” is a binary label denote by 0 and 1, where 0 denote “customer did not make a purchase” and 1 denote “customer made a purchase”.
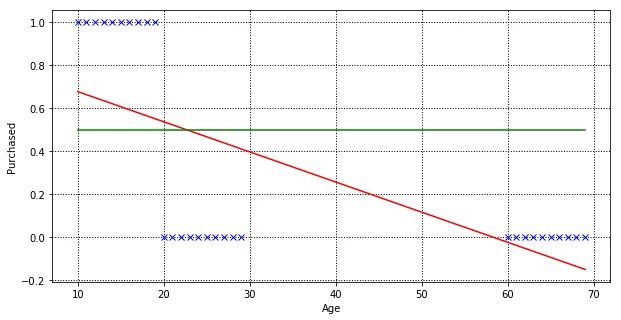
The objective of a linear regression model is to find a relationship between the input variables and a target variable. Below is our linear regression model that was trained using the above dataset. The red line is the best fit line for the training dataset, which aims to minimise the distance between the predicted value and actual value.
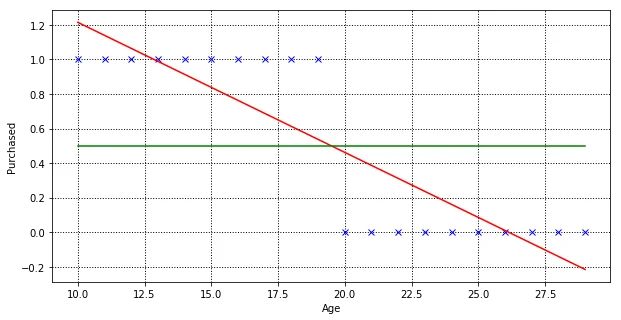
To use this model for prediction is pretty straight forward. Given any age, we are able to predict the value along the Y-axis. If Y is greater than 0.5 (above the green line), predict that this customer will make purchases otherwise will not make purchases.
+-----+-------------------+
| Age | Predicted Y Value |
+-----+-------------------+
|  10 |        1.21428571 |
|  15 |        0.83834586 |
|  19 |        0.53759398 |
|  20 |        0.46240602 |
|  25 |        0.08646617 |
|  30 |       -0.28947368 |
+-----+-------------------+
Problem #1: Predicted value is continuous, not probabilistic
In a binary classification problem, what we are interested in is the probability of an outcome occurring. Probability is ranged between 0 and 1, where the probability of something certain to happen is 1, and 0 is something unlikely to happen. But in linear regression, we are predicting an absolute number, which can range outside 0 and 1.
Using our linear regression model, anyone age 30 and greater than has a prediction of negative “purchased” value, which don’t really make sense. But sure, we can limit any value greater than 1 to be 1, and value lower than 0 to be 0. Linear regression can still work, right?
Yes, it might work, but logistic regression is more suitable for classification task and we want to prove that logistic regression yields better results than linear regression. Let’s see how logistic regression classifies our dataset.
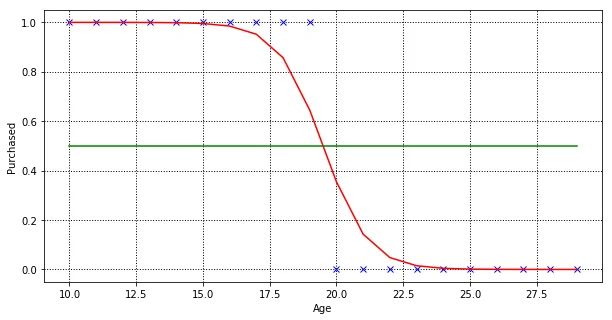
Now we have 2 models trained on the same dataset, one by linear regression, and another by logistic regression. We can compare both models performance by using root mean squared error (RMSE) and the coefficient of determination (R² score).
+---------------------+--------------------+----------------------+
|                     | R2 (higher better) | RMSE (lower better)  |
+---------------------+--------------------+----------------------+
| Linear regression   | 0.7518796992481203 | 0.062030075187969935 |
| Logistic regression | 0.9404089597242656 | 0.014897760068933596 |
+---------------------+--------------------+----------------------+
R² is a measure of how closely the observed data points are to the fitted regression line, generally the higher the better. But R² alone is not enough, so we look at RMSE as well. RMSE measure how far the observed data points are to the model’s predicted values, the lower the better.
From the metrics, logistic regression performed much better than linear regression in classification tasks. Like how Cassie Kozyrkov quotes it:
Neural networks may as well be called “yoga networks” — their special power is giving you a very flexible boundary.
Problem #2: Sensitive to imbalance data
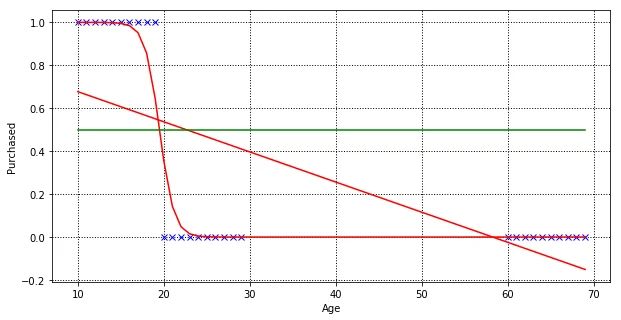
Let’s add 10 more customers age between 60 to 70, and train our linear regression model, finding the best fit line.
Our linear regression model manages to fit a new line, but if you look closer, some customers (age 20 to 22) outcome are predicted wrongly.
+-----+-------------------+
| Age | Predicted Y Value |
+-----+-------------------+
|  18 |        0.56495292 |
|  19 |        0.55091537 |
|  20 |        0.53687781 |
|  21 |        0.52284026 |
|  22 |        0.50880271 |
|  23 |        0.49476516 |
|  24 |        0.48072761 |
|  25 |        0.46669006 |
+-----+-------------------+
As linear regression tries to fit the regression line by minimising prediction error, in order to minimise the distance of predicted and actual value for customers age between 60 to 70. Let’s train a logistic regression model with the same dataset.
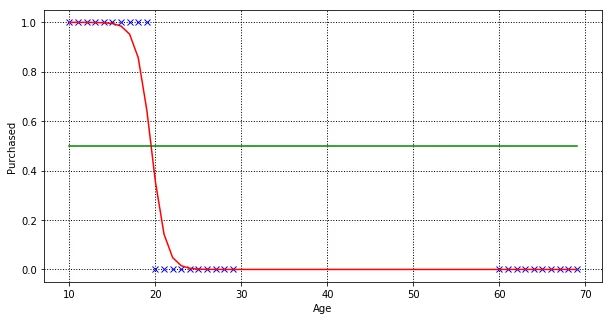
Yes! In this very simple dataset, logistic regression manages to classify all data points perfectly.
+-----+-------------------+
| Age | Predicted Y Value |
+-----+-------------------+
|  18 |        0.85713668 |
|  19 |        0.64502441 |
|  20 |        0.35497751 |
|  21 |        0.14286435 |
|  22 |        0.04805457 |
+-----+-------------------+
Let’s compare the R² and RMSE again for both models, and you will see that logistic regression does a way better job than linear regression.
+---------------------+---------------------+----------------------+
|                     | R2 (higher better)  | RMSE (lower better)  |
+---------------------+---------------------+----------------------+
| Linear regression   |  0.4211265134234073 |  0.12863855257257611 |
| Logistic regression |  0.9553066567250715 |  0.00993185406109522 |
+---------------------+---------------------+----------------------+
Conclusion
Linear regression is suitable for predicting output that is continuous value, such as predicting the price of a property. Its prediction output can be any real number, range from negative infinity to infinity. The regression line is generally a straight line.
Whereas logistic regression is for classification problems, which predicts a probability range between 0 to 1. For example, predict whether a customer will make a purchase or not. The regression line is a sigmoid curve.
Notebook
Check out the codes used in this article in this notebook.